Savings challenge printable
Colour in a box every time you put money aside.
Examples temporarily replace the input and settings. You can restore your previous work.
Pro keeps the settings you use every week and puts them one click away. See Pro
Preview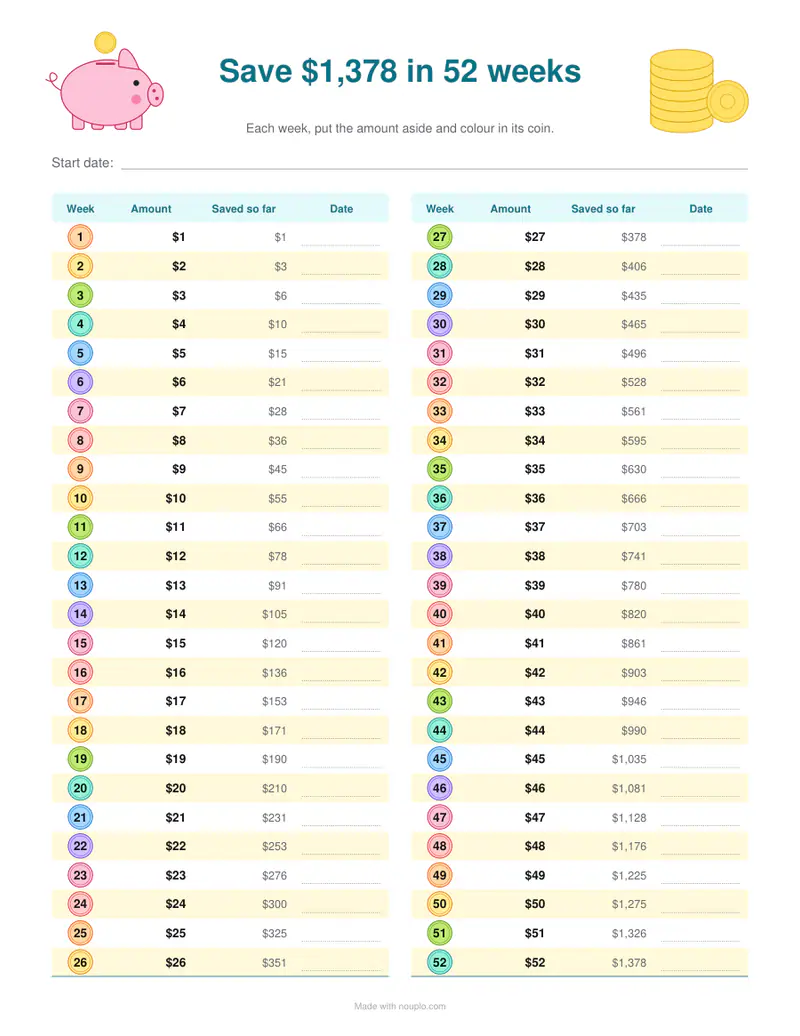
Free PDFs end with a small “Made with nouplo.com” line Remove limits with Pro
Save to PinterestYour files stay on your device
This tool runs entirely in your browser. Nothing is uploaded, nothing is stored, and you can even turn off your internet connection before you start.
Example
Worked example — Savings challenge printable
Choose the 52-week challenge, the 100 envelope challenge or your own goal. Use the following inputs and settings. Keep the other settings at the page defaults.
| Item | Value |
|---|---|
| Challenge | 52-week challenge |
| Amount per step (week 1 / envelope 1) | 1 |
| Output files | 1 |
| PDF pages | 1 |
| Paper | 216 × 279 mm |
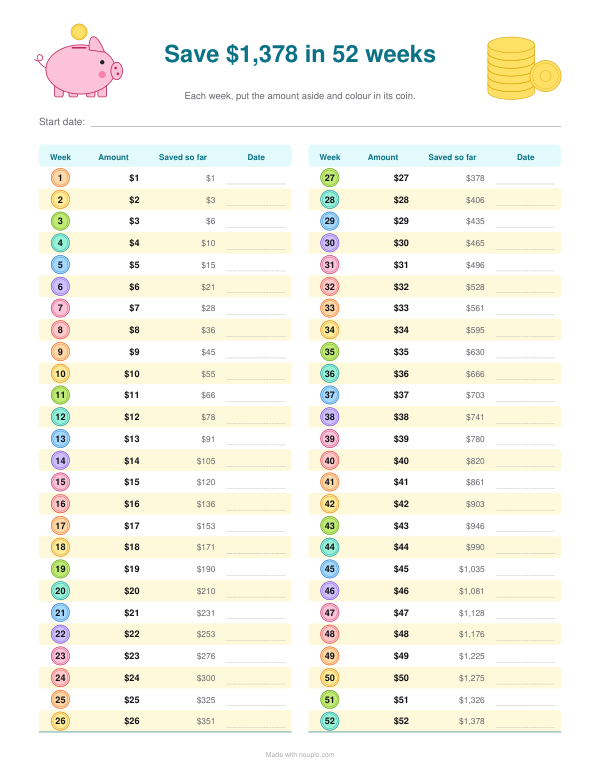
Expected result — PDF · PDF pages: 1 · 216 × 279 mm. The preview shows the first PDF page.
How it works
- Choose the 52-week challenge, the 100 envelope challenge or your own goal.
- Set the amount per step or the goal; the totals are worked out for you.
- Print, put it on the fridge and colour a box each time you save.
Frequently asked questions
- How does the 52-week challenge work?
- Save $1 in week one, $2 in week two and so on up to $52 in the last week: $1,378 in a year. With a step of $5 it’s $6,890. You can also start at week 52 when money is easier in January.
- What is the 100 envelope challenge?
- One hundred envelopes numbered 1 to 100; each day or week you pick one and put in that amount. All of them add up to $5,050 — colour the box of each envelope you fill.
- How do I set my own goal?
- Type the goal and choose 50, 100 or 200 boxes: the goal is split into equal round amounts, the last box takes what’s left.
- Can I use another currency?
- Yes — type a symbol or code like €, £ or CAD; left empty, the usual currency for your language is used.
- Is anything uploaded?
- No. The chart is made in your browser.
Related tools
⤴ Text tools Compound interest calculator What a lump sum and a monthly deposit grow to, year by year. ⌸ Monthly budget planner Planned, actual and the difference, line by line. ☑ Habit tracker printable A square a day for every habit. ⌸ Petty cash log Money in, money out and what is left, line by line.