T-chart template
Two columns, your headings; print the T-chart.
Examples temporarily replace the input and settings. You can restore your previous work.
One box per line, in order. Start a line with a heading and a colon to rename the box, and separate the items with semicolons: “Methods: No checklist; Rushed training”. On a fishbone diagram each line is a bone, and a name alone is a category to fill in. For a T-chart, a topic like “Cats | Dogs” names the two columns; for a story map, “Title | Author”. Leave the box empty for a blank organizer.
Pro keeps the settings you use every week and puts them one click away. See Pro
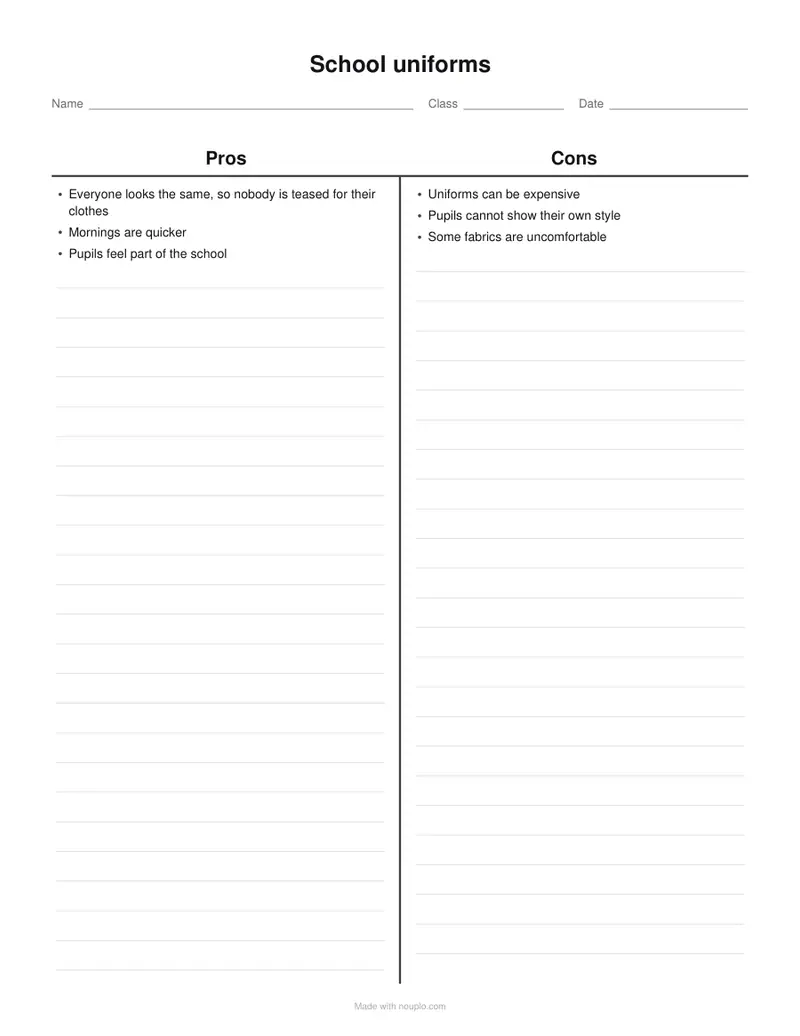
Free PDFs end with a small “Made with nouplo.com” line Remove limits with Pro
Save to PinterestYour files stay on your device
This tool runs entirely in your browser. Nothing is uploaded, nothing is stored, and you can even turn off your internet connection before you start.
Example
Worked example — T-chart template
Use the following inputs and settings. Keep other settings at the page defaults.
| Item | Value |
|---|---|
| Organizer | T-chart |
| Output files | 1 |
| PDF pages | 1 |
| 216 × 279 mm |
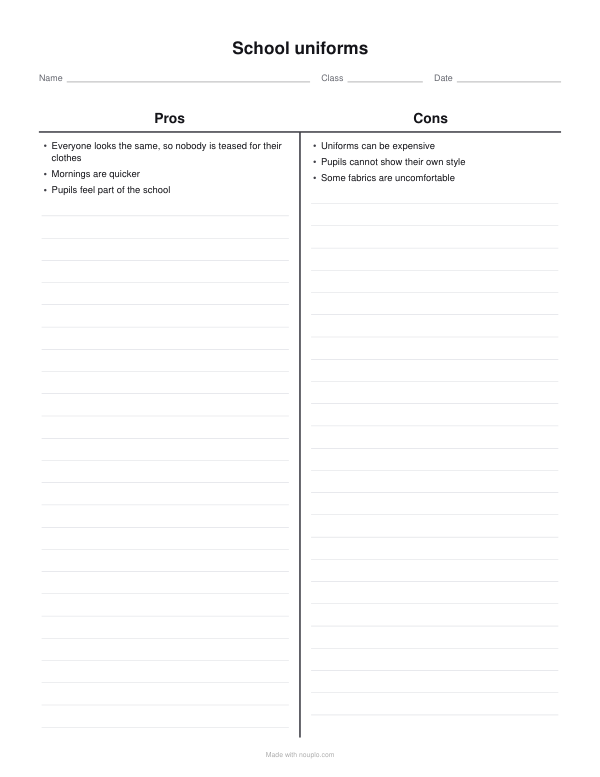
Expected result — PDF · PDF pages: 1. The image shows the first PDF page.
How it works
- Type two headings like “Pros | Cons” or “Cats | Dogs”, and a title if you want one.
- Type the items for each column if you want them filled: one line per column, items separated by semicolons.
- Download the PDF and print it, one or two to a page.
Frequently asked questions
- What is a T-chart used for?
- Comparing two things side by side: pros and cons, facts and opinions, before and after, two characters or two choices to weigh up before a decision.
- How do I change the headings?
- Type them in the topic as “First | Second”, or start each line of the text box with a heading and a colon. With a plain topic, the columns are headed Pros and Cons.
- Can I print two on a page?
- Yes: choose two copies per page for two half-size charts with a cutting line between them.
- Is anything uploaded?
- No. The chart is made in your browser, and nothing you type leaves your device. On the free plan a small line with our name is printed at the foot of the last page.